There is a growing assumption in the data world that modern AI models can handle Tableau calculated fields well enough to be trusted in production workflows. Teams are considering whether AI can replace or augment their Tableau developers. I wanted to test that assumption directly, not with hand-picked examples, but with a structured rubric across a set of tasks that cover the full range of what Tableau developers actually do.
So I built a benchmark. 20 test cases, four models, scored against rubrics with partial credit. The models I tested: ChatGPT-4o, Google Gemini 1.5 Pro, Claude Sonnet 4, and Claude Haiku 4.5. Here is what I found.
How the Benchmark Works
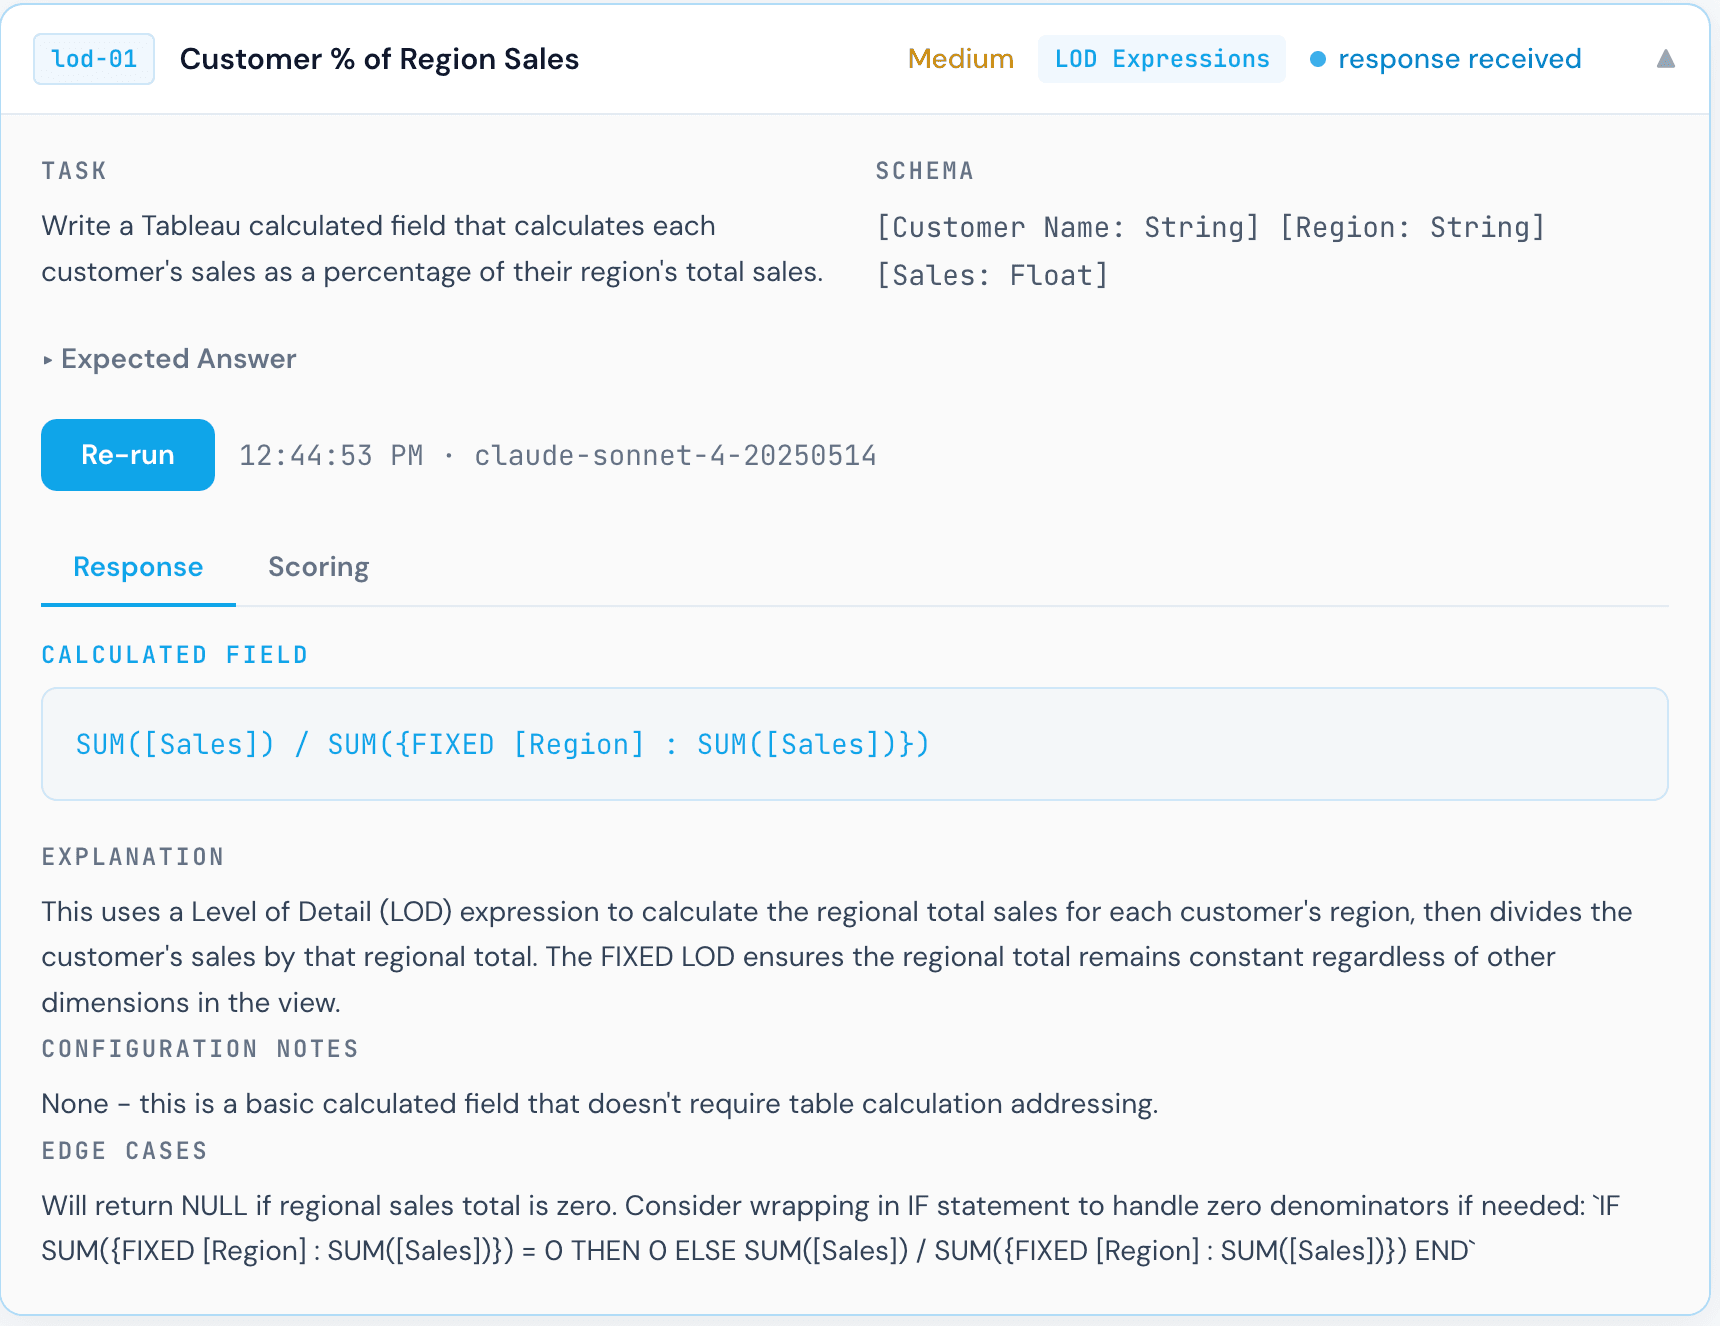
Each test case presents a specific business metric and asks the model to write the Tableau calculated field that computes it. For example, the "Customer % of Region Sales" task provides a schema with [Customer Name], [Region], and [Sales], then asks: write a calculated field that returns each customer's sales as a percentage of their region's total sales. The model responds with a formula. I then score that formula against a rubric with tiered partial credit: the correct FIXED [Region] approach scores 3/3, using the wrong dimension scores 2/3, and a table calculation fallback scores 0/3.
Every formula was scored manually and reviewed by a human to determine whether it is correct. Understanding why a formula is wrong requires Tableau expertise, not just pattern matching, which is why human review is a core part of the process. The 20 test cases span four categories:
LOD Expressions
- Customer % of Region SalesMedium
- First Purchase Date FlagMedium
- Orders Per CustomerEasy
- Top Customer Flag per RegionHard
- Category Total Ignoring Sub-CategoryEasy
Date / Fiscal Logic
- Fiscal Year (Feb Start)Medium
- Fiscal Quarter (Feb Start)Hard
- Days Since Last OrderEasy
- Same Period Last Fiscal YearHard
- Rolling 12-Month SalesMedium
Table Calculations
- Running TotalEasy
- Period-over-Period % ChangeMedium
- Rank Within CategoryMedium
- 3-Month Moving AverageMedium
- % of TotalEasy
Conditional Logic
- Null-Safe DivisionMedium
- Sales Tier ClassificationEasy
- Dynamic Metric SelectorMedium
- Exclude Specific CategoryEasy
- Cohort Condition with Null HandlingHard
Models were evaluated on formula correctness, not explanation quality. A formula that works in Tableau and handles edge cases correctly scores full marks. Plausible-sounding but broken formulas score partial or zero.
The Results
All four models scored within a narrow band, between 78% and 83%, which is both encouraging and telling. Encouraging because these models clearly understand Tableau's logic reasonably well. Telling because none of them scored perfectly, and the failures cluster around the same categories: LOD expression nuance, aggregation correctness, and null handling.
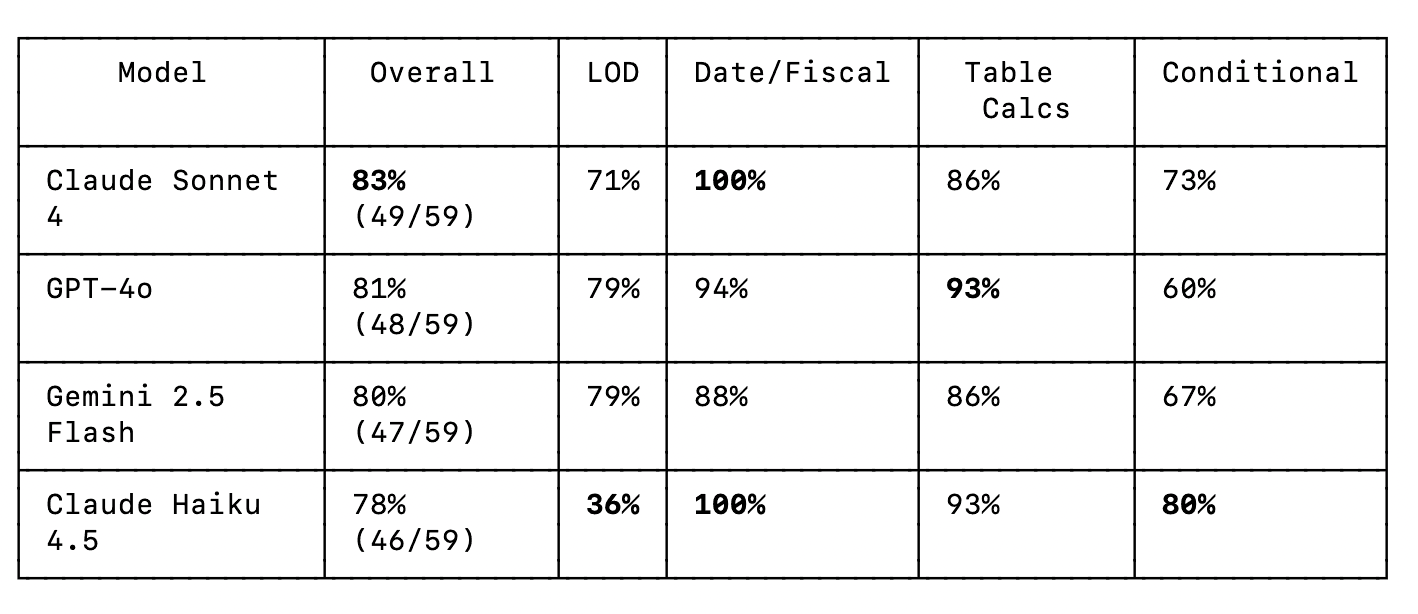
No model is perfect out of the box. Even the top scorer (Claude Sonnet 4 at 83%) missed points on specific formula nuances. This is a reminder that AI-generated Tableau formulas should always be reviewed, especially for anything involving LOD expressions or multi-step fiscal logic.
Dashboard snapshots
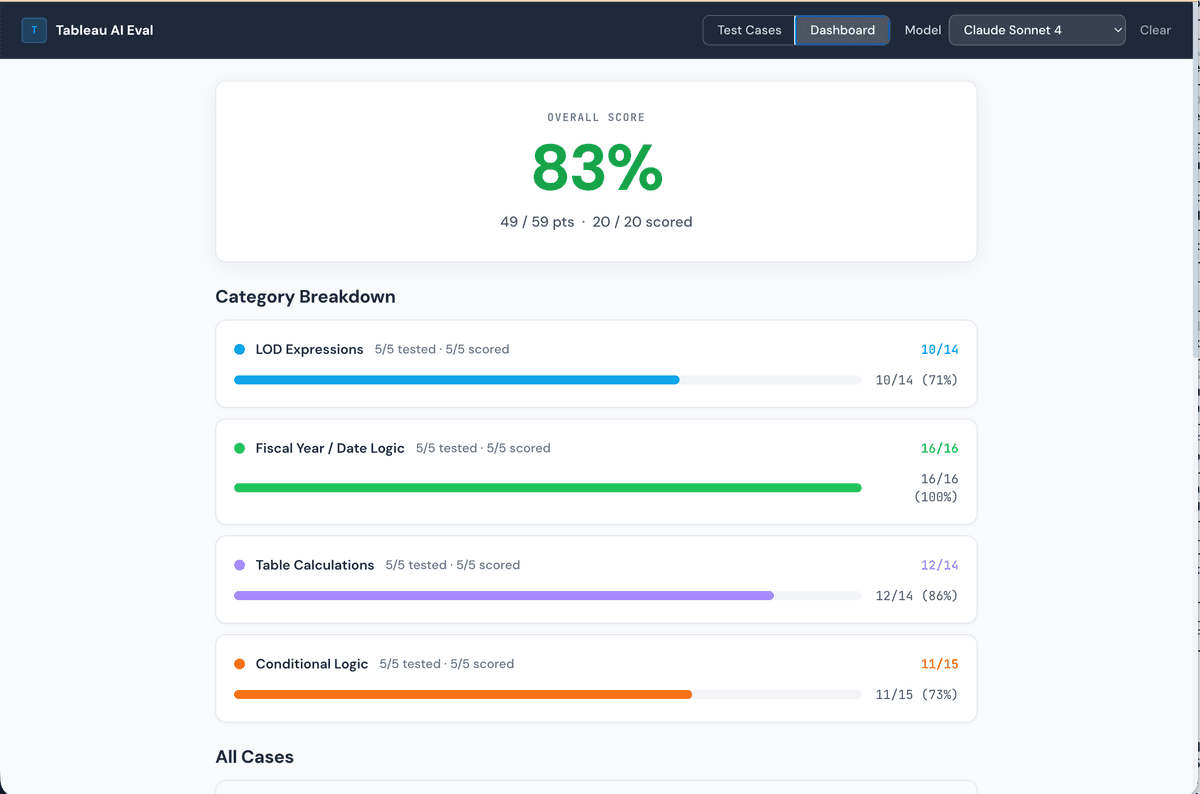
Claude Sonnet 4: 83%
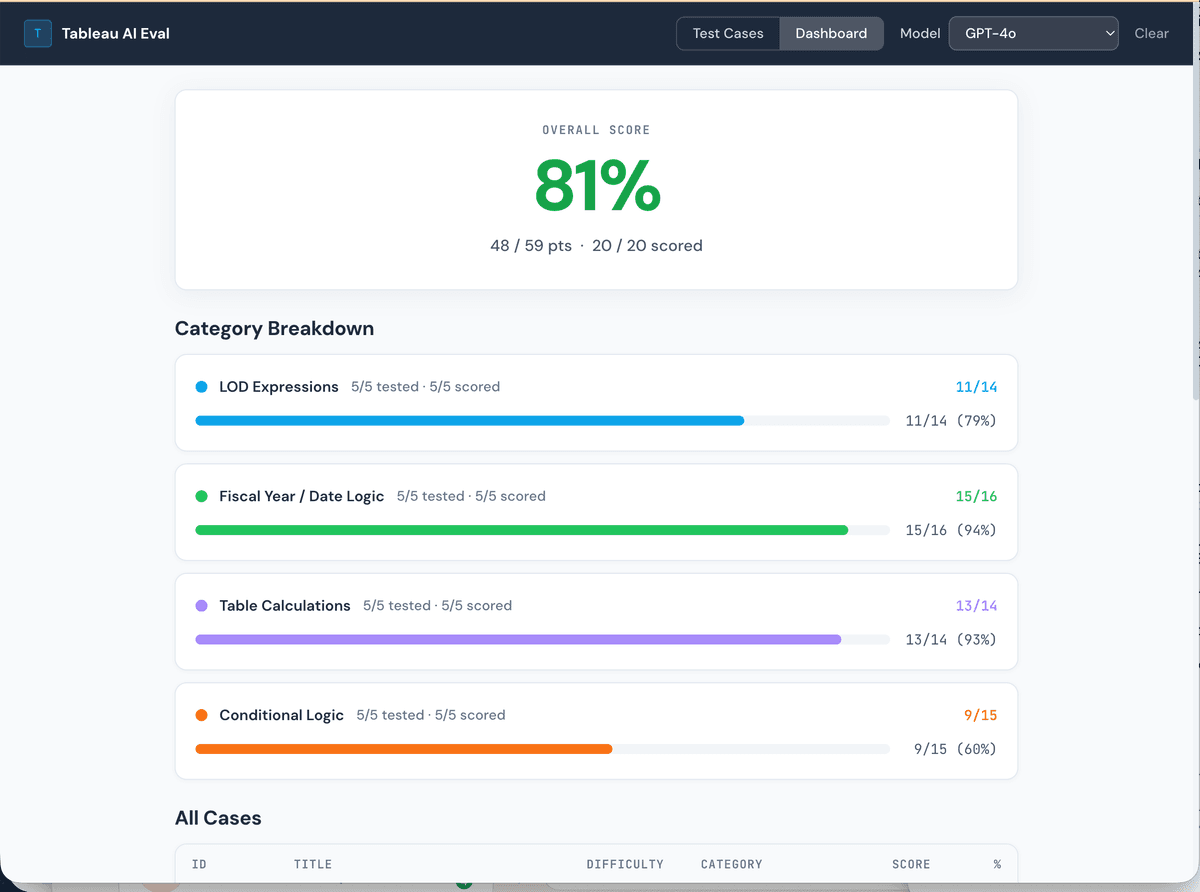
GPT-4o: 81%
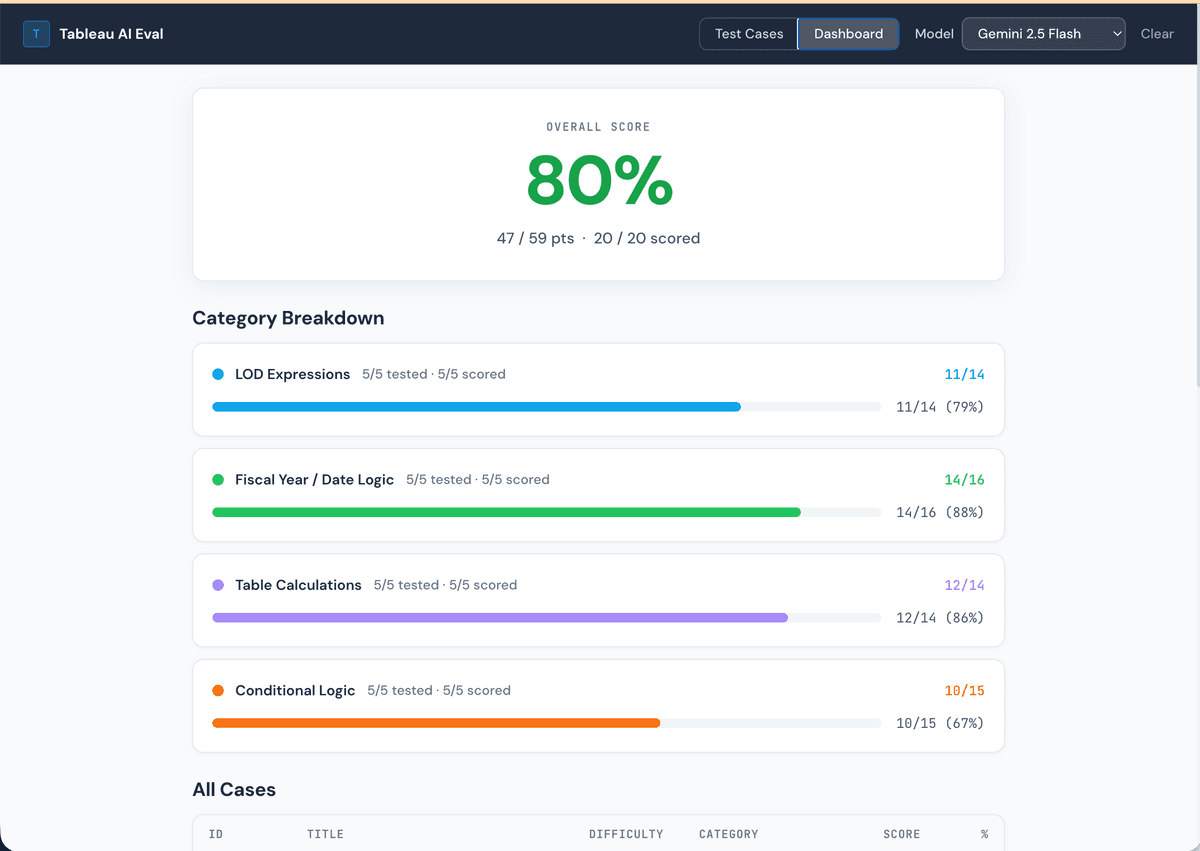
Gemini 1.5 Pro: 80%
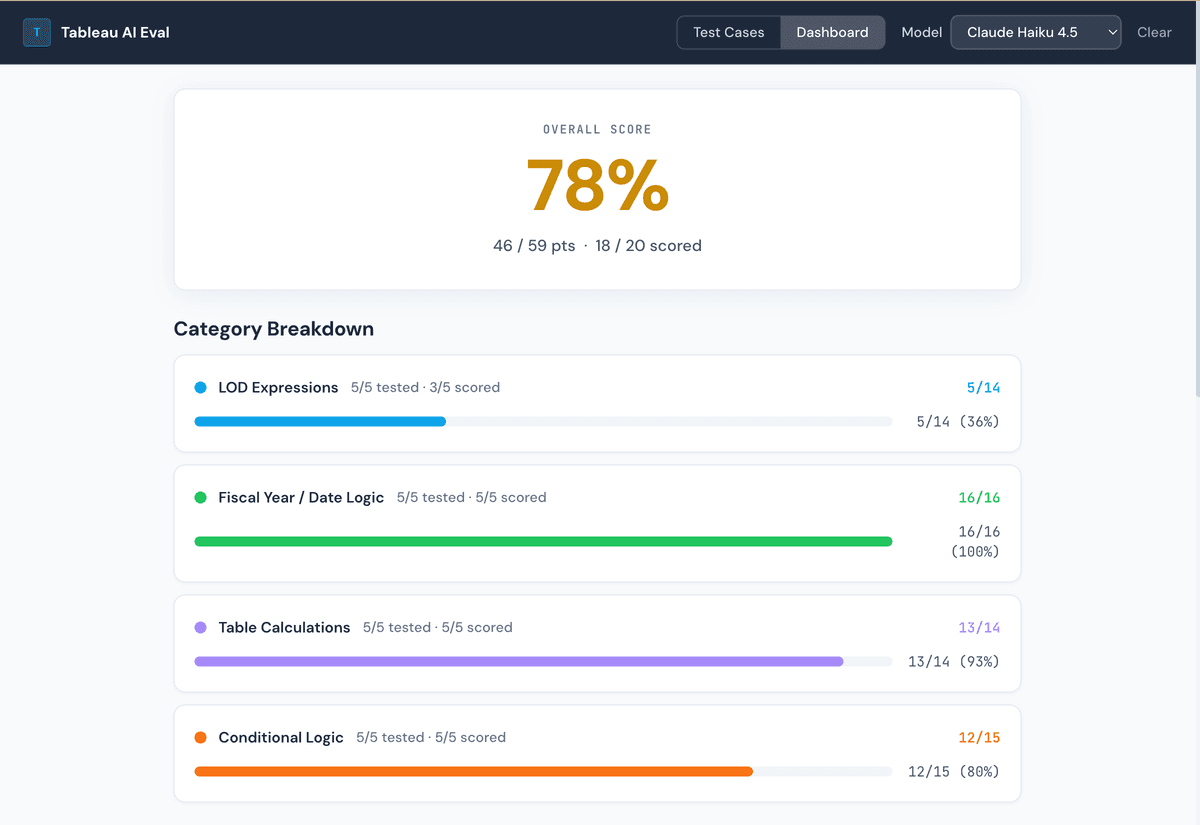
Claude Haiku 4.5: 78%
Where They Diverge: LOD Expression Nuance
The most interesting failures were not on simple tasks. All four models handled conditional logic and basic table calculations reasonably well. The gaps opened up on LOD expressions, where small differences in formula structure produce very different analytical behavior.
The "Customer % of Region Sales" task is a good example. The task is conceptually simple: divide each customer's sales by the total sales for their region. But the correct Tableau formula requires a FIXED LOD expression with [Region] as the dimension. Any deviation from that specific pattern produces the wrong result, and each model made a different mistake.
Correct. The FIXED [Region] LOD computes the total sales for the current row's region, and dividing each row's sales by that denominator gives the correct percentage. This is exactly what the rubric calls for.
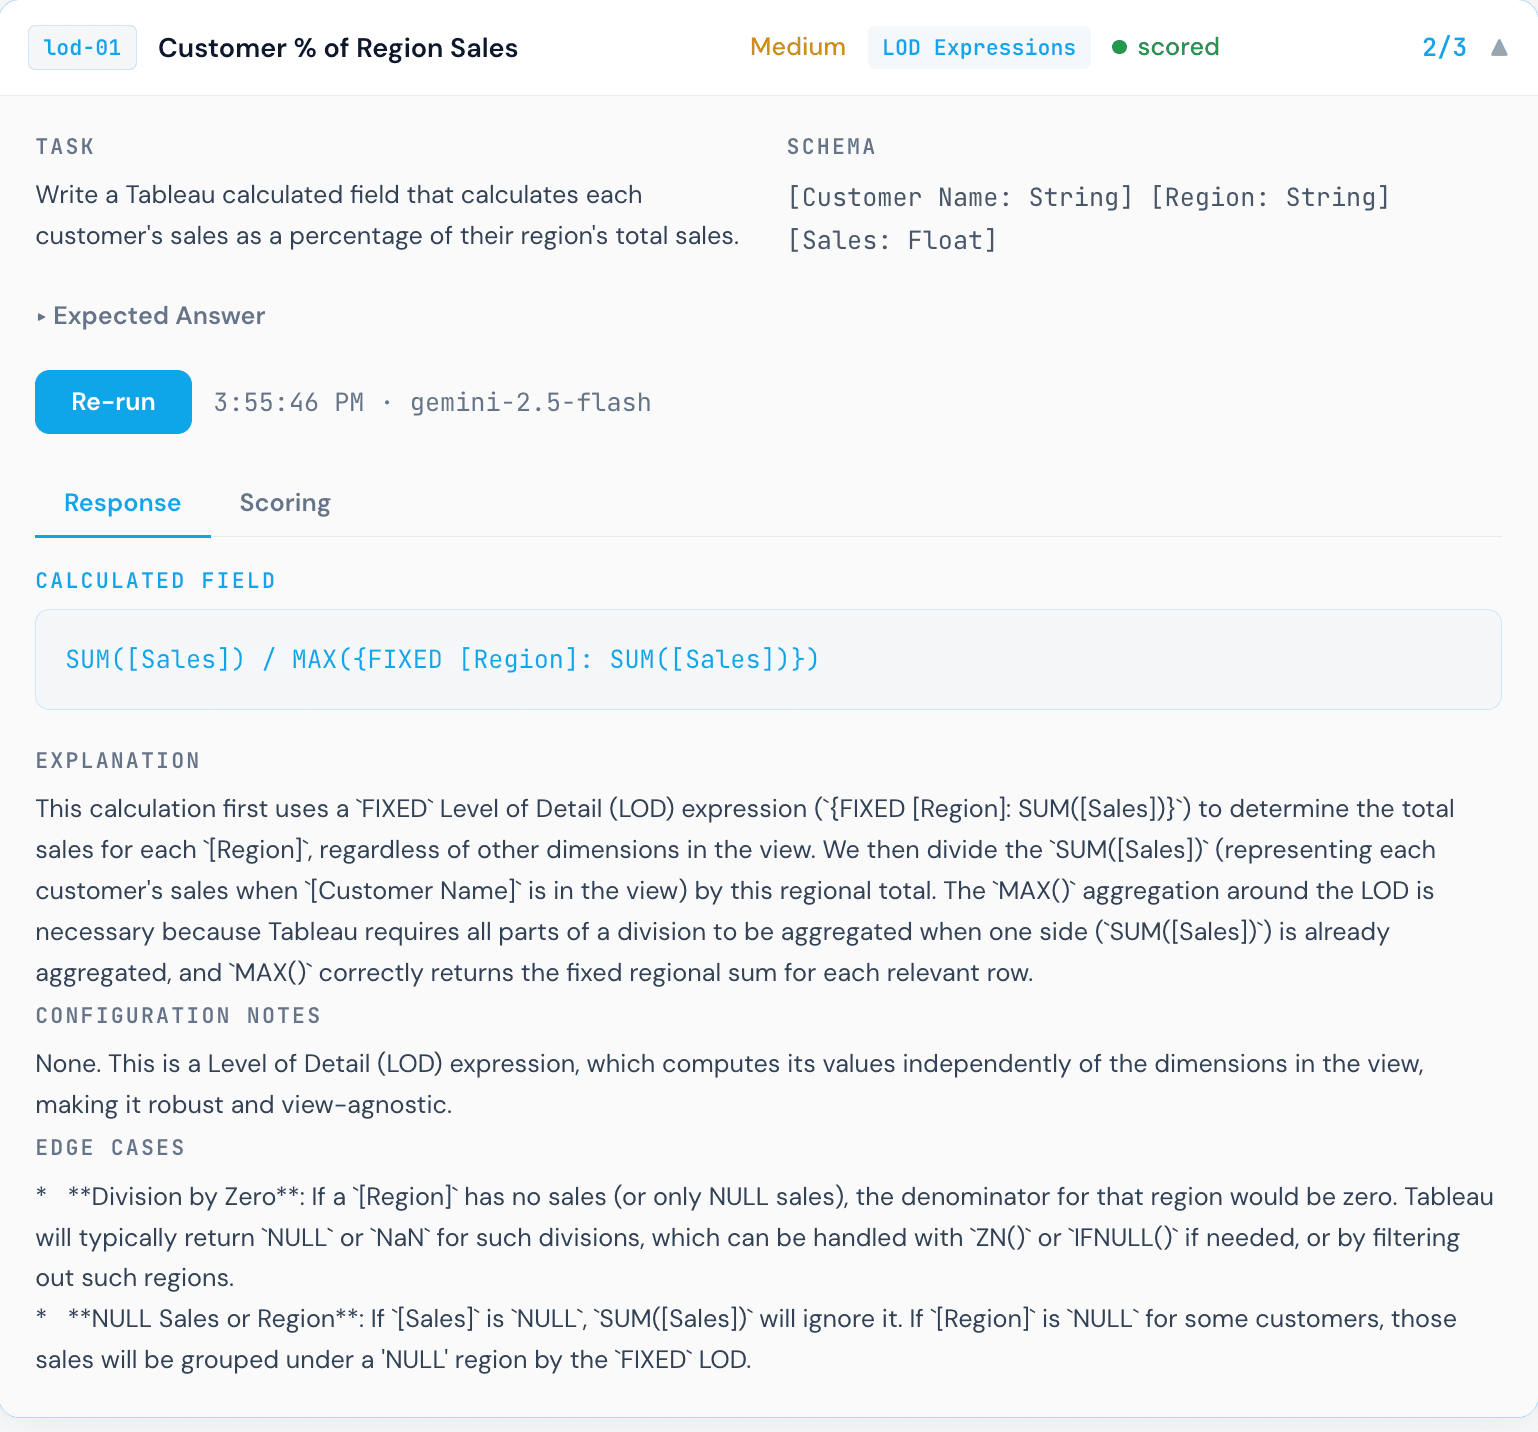
Close, but subtly wrong. The MAX() wrapper around the FIXED LOD changes what gets returned: instead of each row computing the total for its own region, the outer MAX() returns the highest regional total across all regions. Every customer ends up divided by the same (largest) regional total, which is not what was asked. The FIXED expression itself is correct; the unnecessary aggregation wrapper breaks the semantics.
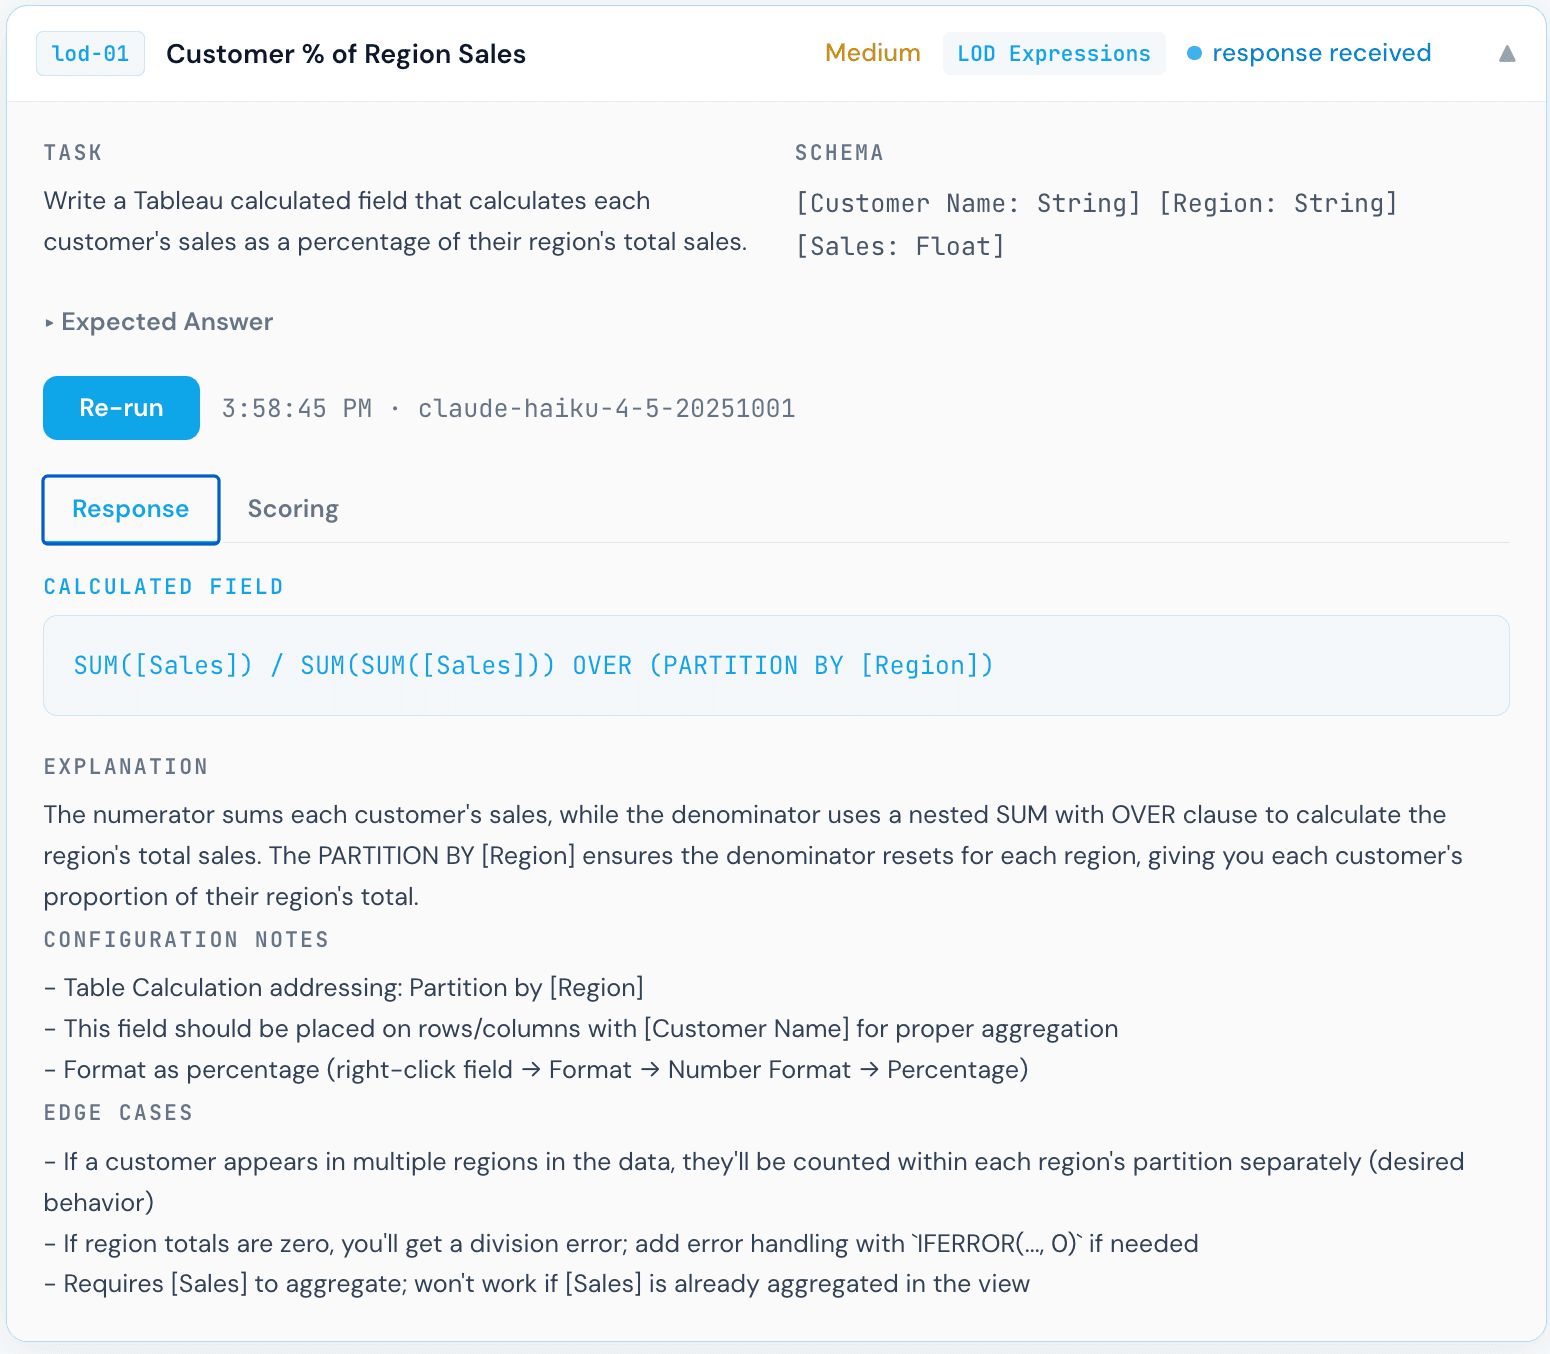
Invalid Tableau syntax. This formula uses OVER (PARTITION BY), which is SQL window function syntax, not Tableau. Tableau calculated fields do not support window function clauses written this way. The formula will not parse, let alone execute. This is the most instructive failure in the benchmark: a model that knows SQL well, but conflates SQL window functions with Tableau's LOD expressions.
Scoring in practice
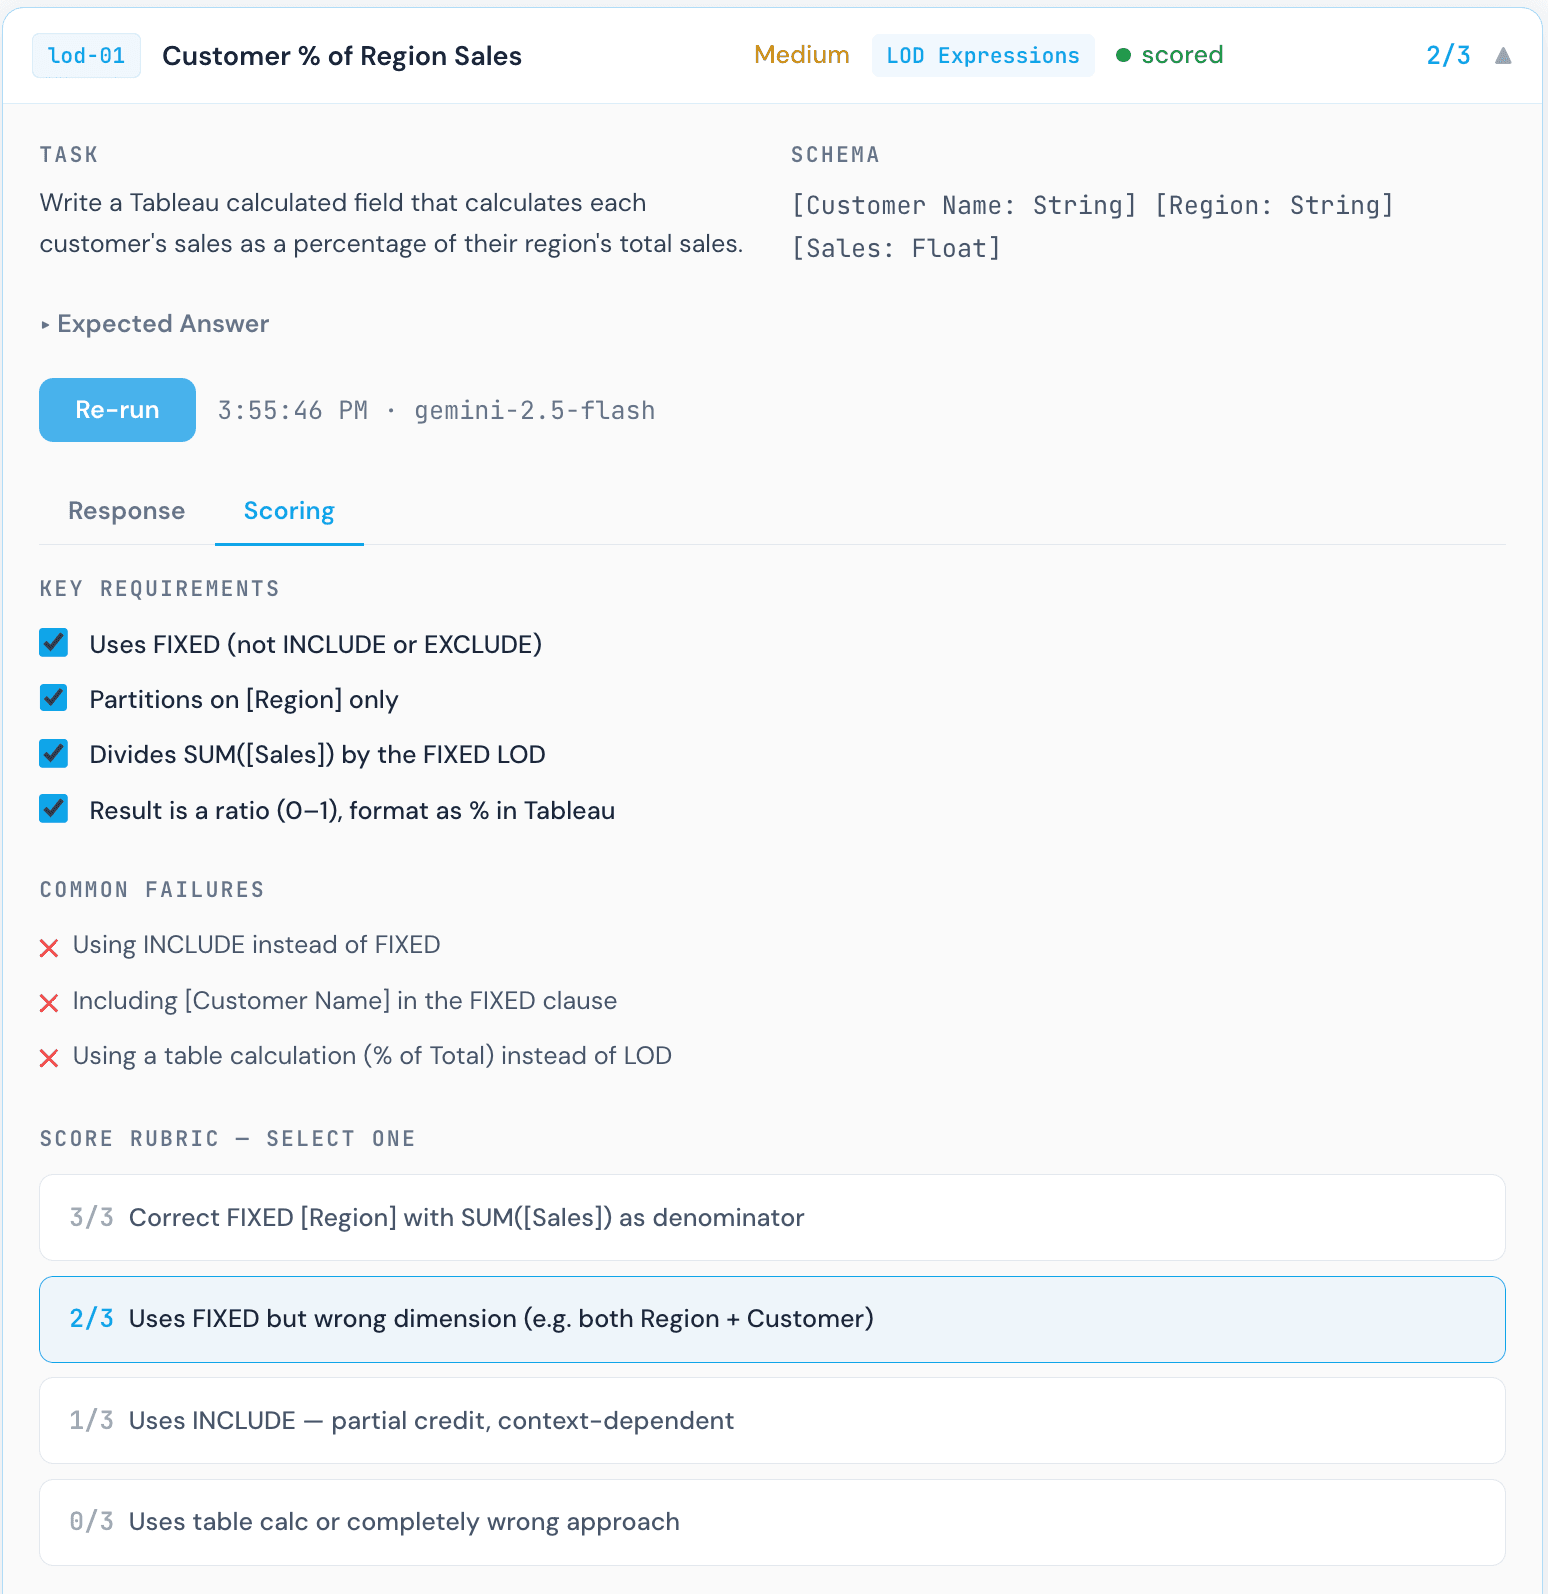
Gemini 1.5 Pro scoring panel for Customer % of Region Sales. Each formula was manually reviewed by a human against the rubric criteria.
This scoring step is worth calling out explicitly. Each response required a Tableau practitioner to read the formula, understand what it actually computes, and map it to the rubric tier. That process revealed something important: a formula can look reasonable at first glance and still be analytically wrong. The Gemini response above is a clear example. The syntax is valid Tableau. It would not throw an error. But the result would be incorrect, and a non-expert reviewer might not catch it.
Why interpretation is critical for agentic semantic layers
Three models, three different interpretations of the same question, and only one was correct. This is exactly why an agentic semantic layer matters. When AI models generate formulas with only a field name to go on, they are guessing at grain, aggregation behavior, and the correct LOD scope. A proper semantic definition that specifies how a field should be aggregated, at what grain, and within which dimensional context dramatically narrows the space of incorrect interpretations. Without that context, even a capable model will produce plausible-looking formulas that fail silently in production.
What 80% Actually Means in Practice
An 80% score across 20 tasks sounds decent. But it means the models are not 100% accurate, and the failures are not evenly distributed. They concentrate in exactly the places where incorrect formulas are hardest to catch: LOD expressions that return plausible-looking but wrong values, fiscal date logic that is off by one month for a specific edge case, and null handling that silently converts nulls to zero.
A Tableau developer reviewing AI-generated formulas needs to know which categories to scrutinize most carefully. Based on this benchmark, that list is:
- →Nested LOD expressions: All models struggled with the top customer flag per region task, which requires a nested FIXED approach. Single FIXED is the most common incorrect answer.
- →Aggregation wrappers on FIXED LODs: Wrapping a FIXED LOD in MAX(), SUM(), or similar functions changes what gets returned in ways that are not obvious from the formula text.
- →Fiscal year edge cases: January behavior in February-start fiscal calendars tripped up multiple models. Off-by-one errors here are silent: the formula runs, it just returns the wrong quarter for January dates.
- →Null semantics vs. zero handling: ZN() and ISNULL() are not interchangeable. Models that defaulted to ZN() lost points because ZN() converts nulls to zero, which has different analytical meaning than a proper null check.
Why I Built This Benchmark
Most AI capability comparisons in the analytics space rely on subjective evaluation or on tasks easy enough for any model to solve correctly. Tableau calculated fields are a better test bed: they have clear right and wrong answers, they require knowledge specific to Tableau's execution model rather than general SQL, and the failure modes are meaningful. A wrong formula does not throw an error. It produces a wrong chart.
I built this to identify the practical issues data practitioners will face when trying to build dashboards with AI. If the metrics are not validated and the model is not given the correct interpretation context, it will produce a confidently wrong result. That distinction matters more as BI tools move toward the agentic era.
This is part of the broader work at Klardata on what it takes to deploy AI reliably in a Tableau environment. The benchmark is designed to evolve: more tasks, more models, and eventually tests that include the context a semantic layer would provide. The goal is not to rank models for marketing purposes. It is to understand where AI assistance is reliable enough to trust, where it needs human review, and what additional context needs to be defined to make AI-generated formulas consistently correct.
If you want help evaluating whether your data catalog is ready for AI, I'd love to talk. Reach out to justin@klardata.com and we can walk through your environment together.
The bigger picture
All four models scored within the same narrow band. That tells you something: they are drawing on similar underlying training about Tableau and SQL, and they hit the same ceiling on tasks that require deep Tableau-specific reasoning. Closing that ceiling requires better context, specifically field definitions, grain documentation, and aggregation rules. Not just a better base model. As teams think about evolving or migrating their BI tools to leverage AI, the developers closest to the data will need to think carefully about how each metric should be interpreted by the model, and make those definitions explicit before trusting AI-generated output in production.